Matplotlib:tick_params 用于更改刻度、刻度标签和网格线的外观。
语法
Axes.tick_params(axis=‘both’, **kwargs)
参数:
| Parameter | Value | Use |
|---|---|---|
| axis | {‘ x ‘, ‘ y ‘, ‘ both ‘},可选 | 将参数应用于哪个轴。默认设置是“两个”。 |
| reset | bool,默认:False | 如果为True,在处理其他关键字参数之前,将所有参数设置为默认值。 |
| which | 默认是“主要”;应用勾号的参数。 | |
| direction | 将刻度置于坐标轴内、轴外,或同时置于两者。 | |
| length | float | 以点为单位的滴答长度。 |
| width | float | 默认是“主要”;应用勾号的参数。 |
| color | 颜色 | 蜱虫的颜色。 |
| pad | float | 标记和标签之间的点距离。 |
| labelsize | float或str | 标记的字体大小以点表示或以字符串形式表示(e.g;,“大”)。 |
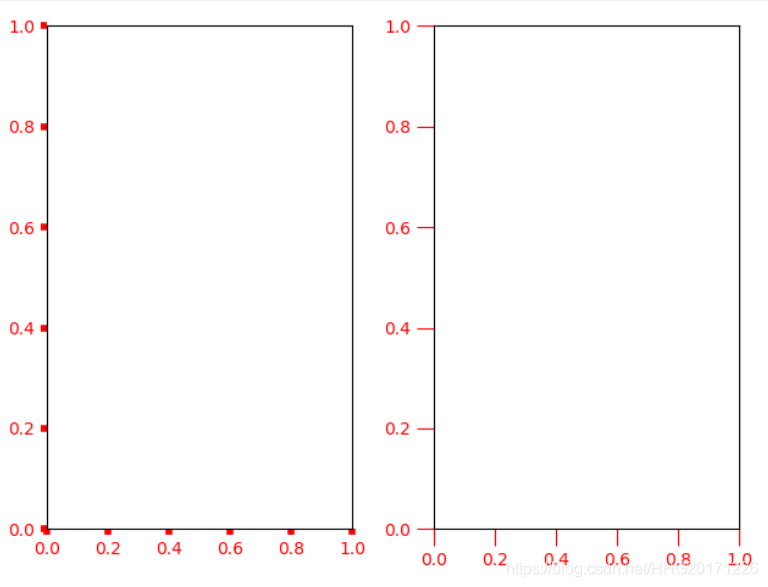
参数axis
参数axis的值为 ’ x’、‘y’、‘both’,分别代表设置X轴、Y轴以及同时设置,默认值为’both’。
import numpy as np
import matplotlib.pyplot as pltplt.subplot(131)
plt.tick_params(axis='x',width=4,colors='red')plt.subplot(132)
plt.tick_params(axis='y',width=4,colors='red')plt.subplot(133)
plt.tick_params(axis='both',width=4,colors='red')plt.show()
参数 which
参数which的值为 'major'、'minor'、'both',分别代表设置主刻度线、副刻度线以及同时设置,默认值为'major'
首先开启副刻度线plt.minorticks_on()
plt.subplot(131)
plt.minorticks_on()
plt.tick_params(which='major',width=2,colors='r')plt.subplot(132)
plt.minorticks_on()
plt.tick_params(which='minor',width=2,colors='r')plt.subplot(133)
plt.minorticks_on()
plt.tick_params(which='both',width=2,colors='r')plt.show()
参数direction
direction的值为'in'、'out'、'inout',分别代表刻度线显示在绘图区内侧、外侧以及同时显示
plt.subplot(131)plt.minorticks_on()plt.tick_params(direction='in', width=2, length=4, colors='r')plt.subplot(132)plt.minorticks_on()plt.tick_params(direction='out', width=2, length=4, colors='r')plt.subplot(133)plt.minorticks_on()plt.tick_params(direction='inout', width=2, length=4, colors='r')plt.show()
参数 length和width
参数length和width分别用于设置刻度线的长度和宽度
plt.subplot(121)
plt.tick_params(width=4, colors='red')plt.subplot(122)
plt.tick_params(length=10,colors='red')plt.show()
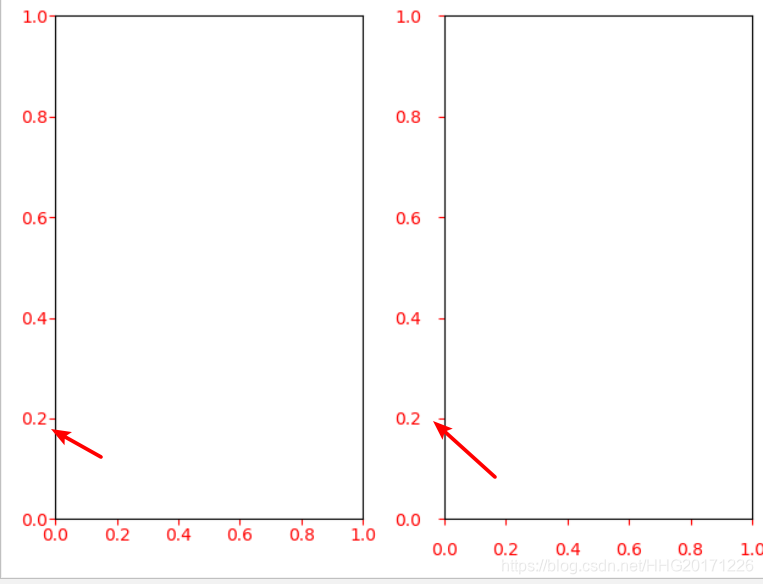
参数 pad
参数pad用于设置刻度线与标签间的距离
plt.subplot(121)
plt.tick_params(pad=1, colors='red')plt.subplot(122)
plt.tick_params(pad=10,colors='red')plt.show()
参数color、labelcolor、colors
参数color、labelcolor、colors分别用于设置刻度线的颜色、刻度线标签的颜色以及同时设置刻度线及标签颜色
plt.subplot(131)
plt.tick_params(width=4,color='r')plt.subplot(132)
plt.tick_params(width=4,labelcolor='r')plt.subplot(133)
plt.tick_params(width=4,colors='r')plt.show()

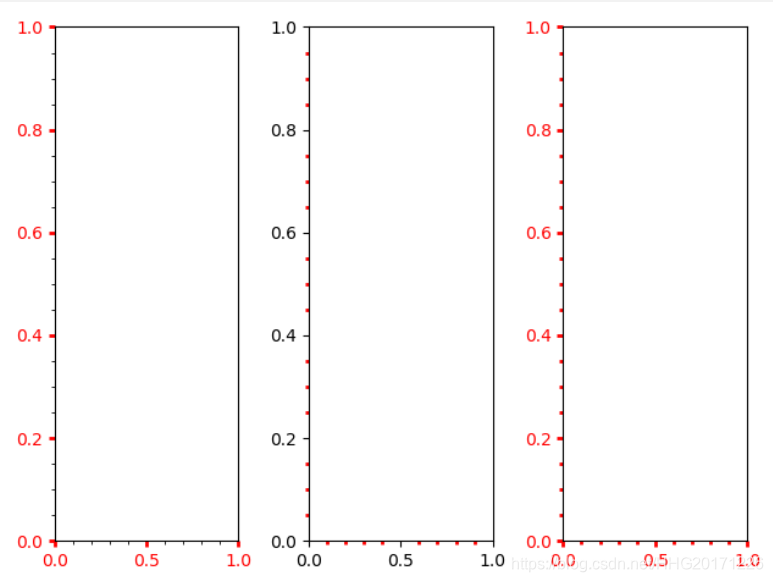
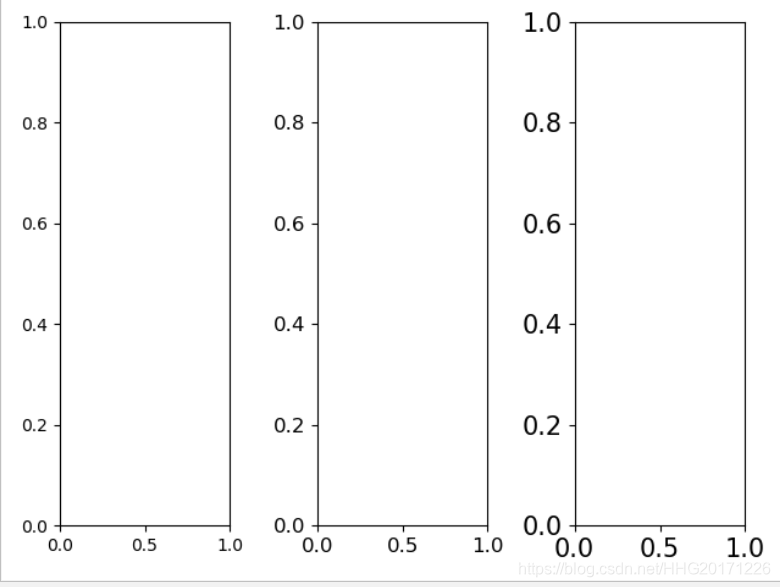
参数 labelsize
参数labelsize用于设置刻度线标签的字体大小
plt.subplot(131)
plt.tick_params(labelsize='medium')plt.subplot(132)
plt.tick_params(labelsize='large')plt.subplot(133)
plt.tick_params(labelsize=15)plt.show()
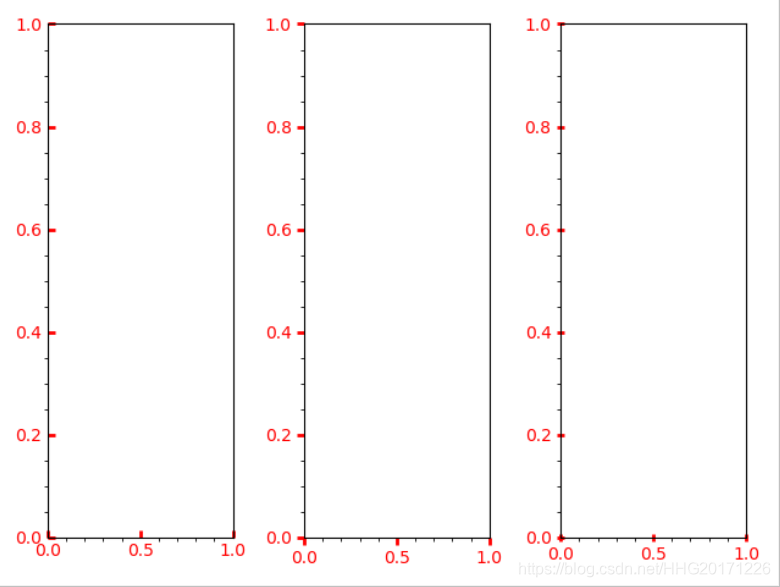
参数bottom, top,left, right
参数bottom, top, left, right的值为布尔值,分别代表设置绘图区四个边框线上的的刻度线是否显示
plt.subplot(131)
plt.tick_params(bottom=False,top=True,width=4,colors='r')plt.subplot(132)
plt.tick_params(left=False,right=True,width=4,colors='r')plt.subplot(133)
plt.tick_params(top=True,right=True,width=4,colors='r')

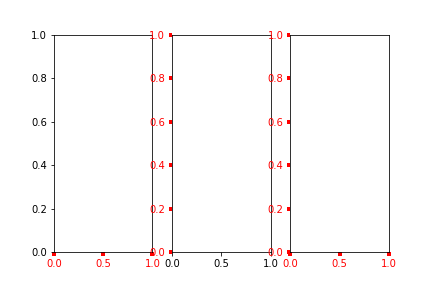
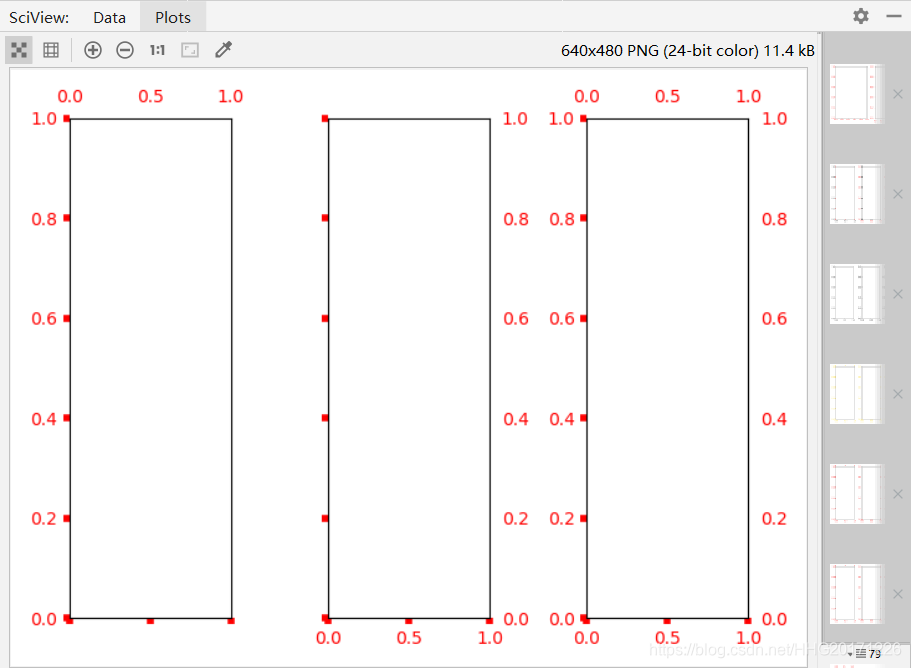
参数labelbottom,labeltop, labelleft, labelright
参数labelbottom, labeltop, labelleft, labelright的值为布尔值,分别代表设置绘图区四个边框线上的刻度线标签是否显示
plt.subplot(131)
plt.tick_params(labelbottom=False,labeltop=True,width=4,colors='r')plt.subplot(132)
plt.tick_params(labelleft=False,labelright=True,width=4,colors='r')plt.subplot(133)
plt.tick_params(labeltop=True,labelright=True,width=4,colors='r')
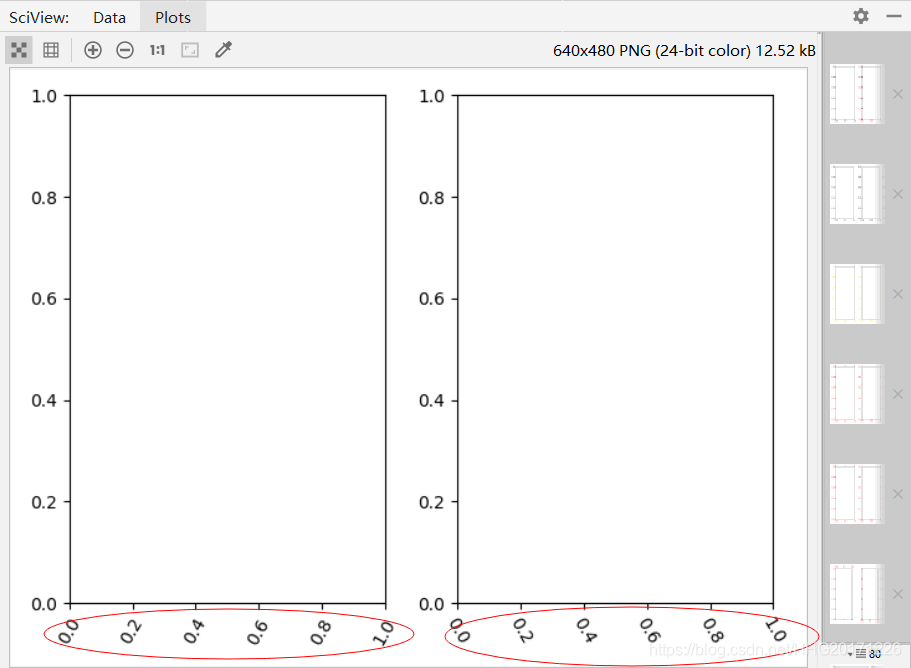
参数 labelrotation
标签旋转
plt.subplot(121)
plt.tick_params(axis="x",labelrotation=60)plt.subplot(122)
plt.tick_params(axis="x",labelrotation=-60)