简介
本文介绍了自建k8s集群的监控实践,采用Prometheus、Node Exporter、Grafana等组件实现对集群的监控。
Prometheus安装
一开始我在Prometheus的安装方案上产生了纠结。
- 方案一:采用Prometheus Operator部署
- 优点:可以通过yaml资源来操作Prometheus,自动化、简化Prometheus配置
- 缺点:学习成本高,需要学习Operator相关的资源配置;设计中没有NodeMonitor,对Kurbernets cAdvisor进行监控实现困难
- 方案二:采用Deployment+ConfigMap部署
- 优点:配置直观,没有黑魔法
- 缺点:资源文件全都需要自己写,更新配置需要额外的组件,需要引入config reloader来更新Prometheus配置。
最终采用了方案二的安装方式,但未实现配置更新后自动重启Prometheus。使用的是Agent+中心存储的方式,即集群中使用Prometheus Agent模式,它本身并不存储数据,但会抓取数据并推送到远程服务器存储。
资源文件
apiVersion: v1
kind: ServiceAccount
metadata:name: prometheusnamespace: prometheus---
apiVersion: rbac.authorization.k8s.io/v1
kind: ClusterRole
metadata:name: prometheusnamespace: prometheus
rules:
- apiGroups: [""]resources:- nodes- nodes/metrics- services- endpoints- podsverbs: ["get", "list", "watch"]
- apiGroups: [""]resources:- configmapsverbs: ["get"]
- apiGroups:- discovery.k8s.ioresources:- endpointslicesverbs: ["get", "list", "watch"]
- apiGroups:- networking.k8s.ioresources:- ingressesverbs: ["get", "list", "watch"]
- nonResourceURLs: ["/metrics"]verbs: ["get"]---
apiVersion: rbac.authorization.k8s.io/v1
kind: ClusterRoleBinding
metadata:name: prometheusnamespace: prometheuslabels:app: prometheus
roleRef:apiGroup: rbac.authorization.k8s.iokind: ClusterRolename: prometheus
subjects:
- kind: ServiceAccountname: prometheusnamespace: prometheus---
apiVersion: apps/v1
kind: Deployment
metadata:name: prometheus-writenamespace: prometheus
spec:selector:matchLabels:app: prometheus-writereplicas: 1template:metadata:labels:app: prometheus-writespec:containers:- name: prometheusimage: xxx/premetheus:latest #镜像源ports:- containerPort: 9090name: web-portvolumeMounts:- name: config-volumemountPath: /etc/prometheus- name: cache-volumemountPath: /prometheusargs:- "--config.file=/etc/prometheus/prometheus.yml"- "--agent"resources:requests:memory: "125Mi"cpu: "60m"limits:memory: "200Mi"cpu: "2000m"livenessProbe: #存活探针,判断容器是否健康httpGet:path: /-/healthyport: web-portreadinessProbe: #就绪探针,判断容器是否已准备好接收流量httpGet:path: /-/readyport: web-portvolumes:- name: config-volumeconfigMap:name: prometheus-config- name: cache-volumeemptyDir:sizeLimit: 500MiserviceAccountName: prometheus
---
apiVersion: v1
kind: Service
metadata:name: prometheus-write-svc
spec:clusterIP: Noneselector:app: prometheus-writeports:- port: 9090targetPort: 9090
prometheus.yaml文件配置
# my global config
global:scrape_interval: 15s # Set the scrape interval to every 15 seconds. Default is every 1 minute.evaluation_interval: 15s # Evaluate rules every 15 seconds. The default is every 1 minute.# scrape_timeout is set to the global default (10s).# Alertmanager configuration# Load rules once and periodically evaluate them according to the global 'evaluation_interval'.
rule_files:# - "first_rules.yml"# - "second_rules.yml"# A scrape configuration containing exactly one endpoint to scrape:
# Here it's Prometheus itself.
scrape_configs:# The job name is added as a label `job=<job_name>` to any timeseries scraped from this config.- job_name: "kubernetes-cadvisor"# Default to scraping over https. If required, just disable this or change to# `http`.scheme: https# Starting Kubernetes 1.7.3 the cAdvisor metrics are under /metrics/cadvisor.# Kubernetes CIS Benchmark recommends against enabling the insecure HTTP# servers of Kubernetes, therefore the cAdvisor metrics on the secure handler# are used.metrics_path: /metrics/cadvisor# This TLS & authorization config is used to connect to the actual scrape# endpoints for cluster components. This is separate to discovery auth# configuration because discovery & scraping are two separate concerns in# Prometheus. The discovery auth config is automatic if Prometheus runs inside# the cluster. Otherwise, more config options have to be provided within the# <kubernetes_sd_config>.tls_config:ca_file: /var/run/secrets/kubernetes.io/serviceaccount/ca.crt# If your node certificates are self-signed or use a different CA to the# master CA, then disable certificate verification below. Note that# certificate verification is an integral part of a secure infrastructure# so this should only be disabled in a controlled environment. You can# disable certificate verification by uncommenting the line below.## insecure_skip_verify: trueauthorization:credentials_file: /var/run/secrets/kubernetes.io/serviceaccount/tokenkubernetes_sd_configs:- role: nodehonor_timestamps: falserelabel_configs:- action: labelmapregex: __meta_kubernetes_node_label_(.+)- job_name: "java-app"# Default to scraping over https. If required, just disable this or change to# `http`.scheme: httpmetrics_path: /assesManageApi/actuator/prometheuskubernetes_sd_configs:- role: podbasic_auth:username: adminpassword: Hzqisheng123.relabel_configs:- source_labels: [__meta_kubernetes_pod_label_app]action: keepregex: asset-management- source_labels: [__meta_kubernetes_namespace]action: replacetarget_label: namespace- job_name: "node-exporter"# Default to scraping over https. If required, just disable this or change to# `http`.scheme: httpsmetrics_path: /metricskubernetes_sd_configs:- role: podrelabel_configs:- source_labels: [__meta_kubernetes_pod_label_app_kubernetes_io_name,__meta_kubernetes_pod_container_port_number]action: keepregex: node-exporter;9100tls_config:insecure_skip_verify: trueauthorization:credentials_file: /var/run/secrets/kubernetes.io/serviceaccount/token
#配置远程服务
remote_write:
- url: https://prometheus.zhihuipk.com/api/v1/writename: center-prometheusbasic_auth:username: xxxpassword: xxx
Node Exporter安装
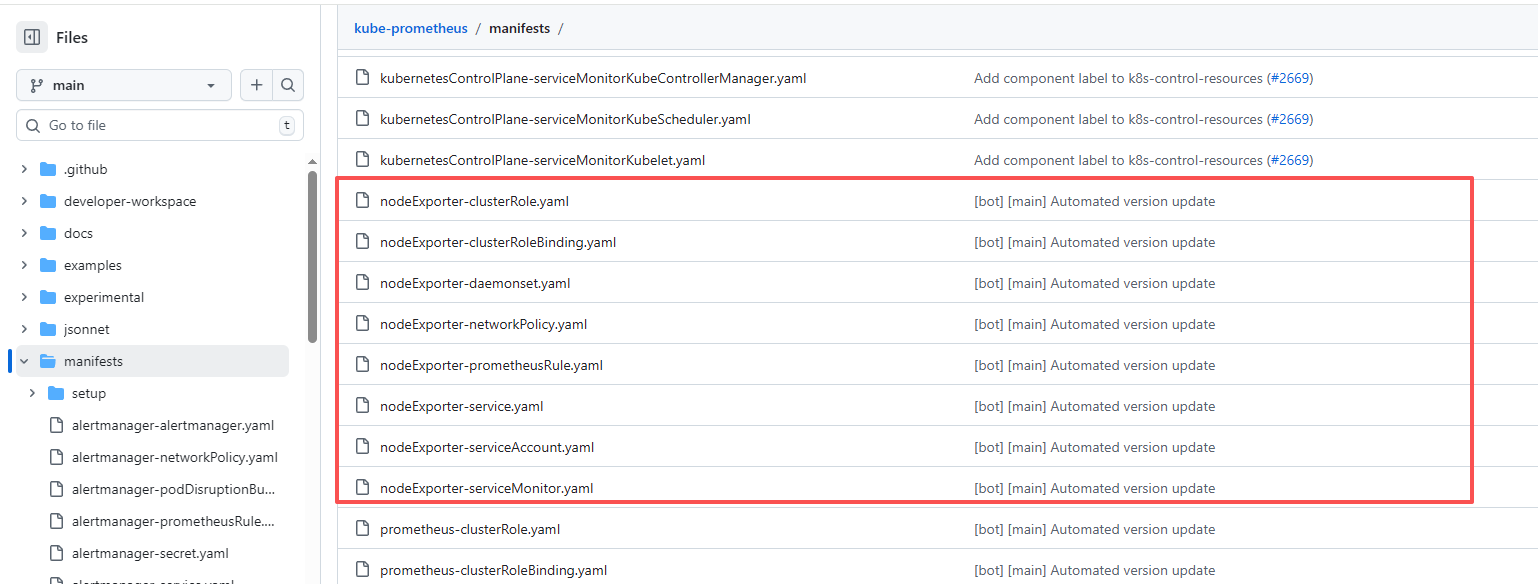
Node Exporter的安装参考kube-prometheus中的关于Node Exporter部分的配置文件
Grafana
安装参考的是官网安装
使用的面板:
- Node Exporter 1860
- Spring Boot 3.0 19004
- Kubernetes Monitoring Dashboard 12740